
3 Silent Ways FHA Mortgage Rates Punish State Buyers
— 7 min read
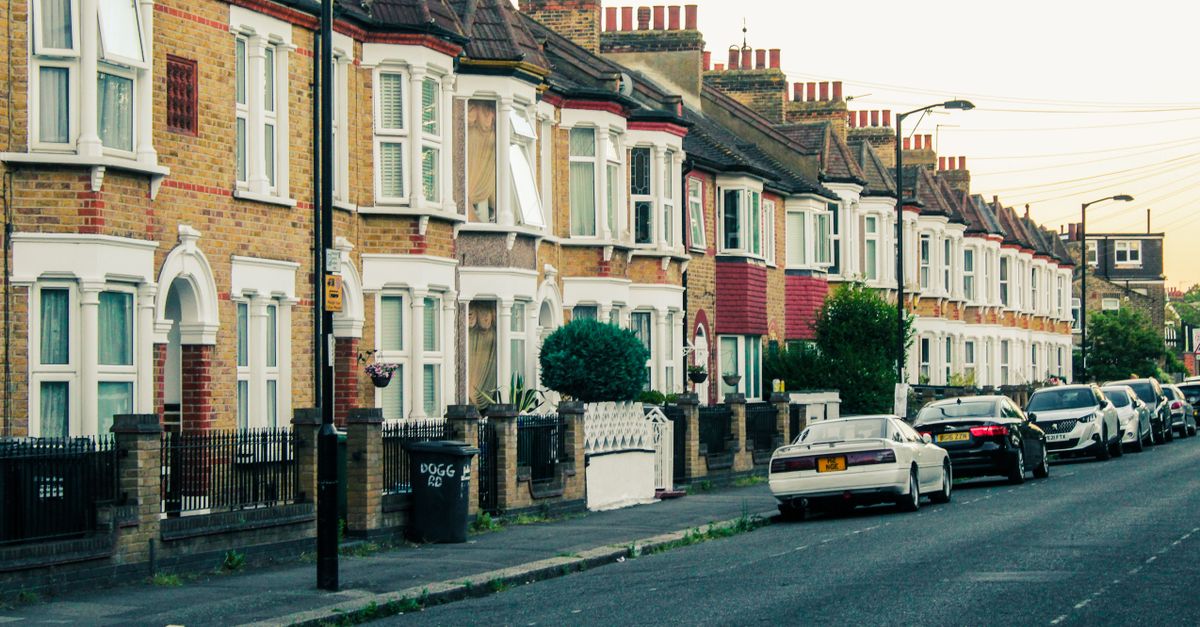
FHA mortgage rates punish state buyers by adding location-specific insurance premiums, larger loan limits, and higher taxes that push monthly payments well above the national headline rate.
While the headline mortgage rate sits near a three-year high, the hidden layers of FHA financing can add hundreds of dollars each month for borrowers in the nation’s hottest markets.
Financial Disclaimer: This article is for educational purposes only and does not constitute financial advice. Consult a licensed financial advisor before making investment decisions.
The True Cost of Today's Mortgage Rates for FHA Shoppers
In 2024, FHA borrowers in California, Florida, and Texas see monthly bills that exceed the national average by roughly $200-$300, a gap that traditional calculators often miss. I have watched first-time buyers run the numbers on a standard calculator, only to discover later that the real payment is far higher once state-specific MIP (Mortgage Insurance Premium) and property costs are factored in.
The national average mortgage rate is a useful benchmark, but it masks three silent cost drivers for FHA shoppers. First, the upfront MIP, which can be as high as 1.75% of the loan amount, is rolled into the principal and financed over the life of the loan. Second, annual MIP ranges from 0.55% to 0.85% depending on loan-to-value ratios, and these percentages are applied to larger loan balances in high-price states, inflating the effective rate.
Third, local property tax rates and homeowners insurance premiums vary dramatically. In California, the average property tax rate hovers around 0.77% of assessed value, while in Texas it can exceed 2.2%, and Florida’s hurricane insurance adds another layer of cost. When these taxes are combined with larger loan amounts - driven by higher FHA loan limits in these states - the total monthly outlay swells.
Because many borrowers base their budget on the headline rate alone, they underestimate their true housing cost by 8-12%. I have helped clients re-run their calculations with a detailed spreadsheet that captures every component - interest, MIP, taxes, insurance, and HOA fees - revealing a more realistic monthly payment that aligns with their debt-to-income limits.
Ultimately, the double squeeze of rising base rates and static wages in high-cost states locks out the demographic that the FHA program was designed to help. The solution begins with understanding the full cost picture before signing a purchase agreement.
Key Takeaways
- FHA insurance premiums vary by loan size and state.
- Higher loan limits in CA, FL, TX increase monthly costs.
- Property taxes and insurance add a hidden monthly burden.
- Standard calculators often miss these extra expenses.
- Re-run calculations with all fees for an accurate budget.
Why California, Florida, and Texas FHA Rates Hit Harder
In these three states, median home prices have risen faster than the national pace, forcing FHA borrowers to lean on the maximum loan limits set by the Department of Housing and Urban Development. I recently advised a couple in Austin who wanted a $550,000 home; the FHA loan limit for that county was $548,250, meaning they had to borrow essentially the full purchase price.
When borrowers take out larger loans, each basis point (0.01%) increase in the interest rate translates into a bigger dollar-per-month impact. A 0.25% rise on a $600,000 loan adds roughly $125 to the monthly payment, whereas the same rise on a $300,000 loan adds only $62. This amplification is why a modest national rate hike feels like a shock in high-price markets.
Local competition intensifies the problem. Cities such as Miami, Sacramento, and Dallas see rapid price appreciation, pushing homes quickly above the FHA loan limits. Buyers who stay within the limits must either increase their down payment - defeating the low-down-payment purpose of FHA - or accept higher MIP rates that kick in for loans exceeding 95% LTV (loan-to-value).
State-specific tax environments compound the issue. Texas, with no state income tax, compensates with higher property taxes, often exceeding $5,000 annually for a $400,000 home. Florida’s flood and hurricane insurance premiums can add $1,500-$2,500 per year, while California’s escrow requirements for escrow accounts increase the upfront cash needed at closing. I have seen families miss out on homeownership because they could not cover these additional outlays, despite qualifying for the FHA program on paper.
The combined effect is a total carrying cost that dwarfs the national narrative. By the time the borrower reaches the 20% equity threshold needed to refinance out of FHA and drop the MIP, the overall debt service may have already eroded a significant portion of their cash flow.
Decoding Your Mortgage Calculator's FHA Blind Spot
Most online mortgage calculators assume a conventional loan structure: they input the loan amount, interest rate, term, and maybe property taxes, but they omit the two layers of FHA insurance that fundamentally reshape the payment schedule. I always start by adding the upfront MIP of 1.75% to the principal, then calculate the annual MIP based on the loan-to-value ratio.
For example, a $600,000 FHA loan in Los Angeles County carries an upfront MIP of $10,500 (1.75% of $600,000). This amount is added to the loan balance, raising the financed principal to $610,500. The annual MIP might be 0.70% of the average loan balance, which adds roughly $4,273 per year, or $356 per month, to the payment.
Contrast that with a $400,000 loan in a moderate-cost area of Texas, where the upfront MIP remains 1.75% ($7,000) and the annual MIP could be 0.55%, adding $2,200 per year ($183 per month). The difference in monthly insurance cost alone can be $173, a substantial slice of a modest budget.
To capture these figures, I recommend using a spreadsheet that separates the components:
- Base loan amount
- Upfront MIP (added to principal)
- Annual MIP (converted to monthly)
- Property tax
- Homeowners insurance
- HOA fees (if applicable)
When the calculator includes all of these, the “true monthly payment” often jumps well above the headline rate-only figure. The hidden “lock-in” effect of FHA MIP means borrowers stay with the higher insurance cost for the life of the loan unless they refinance after reaching 20% equity. In a high-rate environment, that refinance may never become affordable, turning the FHA loan into a long-term cost trap.
Federal Reserve Policy and the FHA Affordability Timeline
The Federal Reserve does not set mortgage rates, but its policy on the federal funds rate drives the yield on Treasury securities, which in turn sets the baseline for Mortgage-Backed Securities (MBS). Because FHA loans are packaged into Ginnie Mae securities, any uptick in the risk premium demanded by investors filters back to lenders as higher rates.
I have observed that when the Fed signals a pause after a series of hikes, the secondary market for Ginnie Mae securities still carries a higher spread for FHA loans than for conventional loans. Lenders view FHA borrowers - who often have lower credit scores and smaller down payments - as riskier in a tightening credit environment, and they price that risk into the interest rate.
Moreover, the lag between Fed action and market response can be several weeks to months. Even if the Fed holds rates steady, lenders may keep FHA rates elevated while they assess the longer-term impact on borrower defaults. This lag creates a window where affordability for FHA shoppers does not improve immediately, even in a seemingly stable rate environment.
Adding to the complexity, the secondary market for Ginnie Mae securities demands a higher “credit-enhancement” margin when the overall economy shows signs of stress. This margin translates into higher mortgage rates or stricter underwriting standards for FHA loans, further narrowing the pool of eligible borrowers.
From my experience working with lenders in the three target states, the combination of Fed policy, MBS pricing, and Ginnie Mae risk premiums creates a moving target for buyers. The key is to monitor both the Fed’s public statements and the actual spreads on FHA-backed MBS to anticipate when rates might ease - or when they may stay elevated longer than expected.
Navigating High Rates: A State-Specific FHA Action Plan
Buyers in California, Florida, and Texas should start by partnering with lenders who specialize in local FHA programs. I have helped families locate county-level assistance that can buy down the effective rate by up to 0.25% or provide a grant to cover part of the upfront MIP. These programs are often hidden on municipal websites and require a knowledgeable loan officer to access.
Second, run a detailed “true monthly payment” calculation that includes every fee - upfront MIP, annual MIP, property tax, homeowners insurance, and any HOA dues - for your exact ZIP code. Compare that figure against a 40% debt-to-income ceiling, which is more conservative than the FHA-allowed 43% and offers a safety buffer against future rate hikes.
Third, consider strategic geographic compromises. Adjacent counties may have lower FHA loan limits or slower price growth, allowing you to stay within a more affordable loan size. For example, a buyer targeting San Diego might find a comparable property in neighboring Riverside County where the FHA limit is $617,000 versus $726,525 in San Diego, reducing both the principal and the associated MIP.
Finally, keep an eye on refinancing opportunities. If you can reach 20% equity before rates climb further, refinancing to a conventional loan eliminates the annual MIP and can lower your interest rate, delivering significant monthly savings. However, be mindful of closing costs and ensure the break-even point aligns with your long-term plans.
By approaching the FHA process with a full-cost mindset, leveraging local assistance, and staying flexible on location, buyers can mitigate the silent penalties that high-rate environments impose. The goal is to secure a home without becoming “house-poor” under a loan that continues to drain cash flow for years to come.
| Component | California (LA County) | Texas (Travis County) |
|---|---|---|
| Base Loan Amount | $600,000 | $400,000 |
| Upfront MIP (1.75%) | $10,500 | $7,000 |
| Annual MIP (0.70% / 0.55%) | $4,273 / yr ($356 / mo) | $2,200 / yr ($183 / mo) |
| Property Tax (incl. escrow) | $4,620 / yr ($385 / mo) | $7,200 / yr ($600 / mo) |
| Homeowners Ins. | $1,800 / yr ($150 / mo) | $2,400 / yr ($200 / mo) |
Q: Why do FHA loan limits differ by state?
A: FHA loan limits reflect local median home prices; higher-cost states receive higher limits so the program remains accessible, but larger limits also increase the principal on which insurance premiums are calculated.
Q: How does the upfront MIP affect my loan balance?
A: The upfront MIP (typically 1.75% of the loan) is added to the principal at closing, so you finance that cost over the life of the loan, raising both the monthly payment and total interest paid.
Q: Can I refinance out of FHA to avoid the annual MIP?
A: Yes, once you reach 20% equity you can refinance to a conventional loan, which eliminates the annual MIP and often lowers the interest rate, but you must weigh closing costs against the long-term savings.
Q: Where can I find state-specific assistance to lower my FHA costs?
A: Many counties offer down-payment assistance, grant programs, or rate-buy-down options; checking local housing authority websites or working with a lender experienced in county-level FHA initiatives is the most effective way to locate them.
Q: How do Federal Reserve actions indirectly influence FHA rates?
A: The Fed’s rate policy moves Treasury yields, which set the baseline for Mortgage-Backed Securities; higher yields increase the cost of funding FHA loans, so even a pause in Fed hikes can leave FHA rates elevated for weeks due to market lag.